
Debug iOS apps on Windows with LLDB, breakpoints and crash logs
This tutorial covers debugging an app running on your iPhone from VS Code on Windows, from connecting the phone to tracking down a crash. It applies to native code written in Swift, Objective-C and C/C++, and works the same way for the native side of Flutter, React Native, Unity and other framework projects. You need an iPhone, a USB cable and a project that already builds with KXBuild. To install KXBuild, see the install page.
Connect and trust the device
Plug your iPhone into the computer with a cable and open the KXBuild view in VS Code. The device node shows the phone’s name, connection type and iOS version. If the device node says “click to set up”, the Apple device drivers aren’t installed yet. Click it and follow the prompts, confirming once as administrator. Running kxdevice doctor on the command line does the same.
The first time you connect, finish two steps on the phone.
- Trust This Computer. Unlock the phone and tap “Trust” in the prompt. The prompt doesn’t appear with a charge-only cable or while the phone is locked.
- Turn on Developer Mode. Go to Settings > Privacy & Security > Developer Mode and turn it on. The phone restarts once, then asks you to confirm. This switch only appears after the phone has been connected to a computer.
The same phone may show up twice, once over USB and once over Wi-Fi. USB is more reliable for installing and debugging. With several phones connected, click the device node or the Status Bar to pick one, and F5 installs to that phone from then on. On the command line, list devices with the command below. The first column is the UDID.
1kxdevice device list
If the list is empty, try another cable or USB port, then unlock the phone and check for the prompt. For other cases, see Set up your device.
The first time you debug on a given iOS version, KXBuild downloads its device symbols. It’s several GB and takes ten minutes or more. Progress shows in a notification. It only happens once, and an interrupted download resumes next time. Until it finishes, breakpoints may not stop or you may see only assembly.
Build with the Debug configuration
Before debugging, check that the build configuration node in the KXBuild view shows Debug. The Release configuration turns on optimization, so breakpoints jump around and variables often can’t be shown. Your keychain folder needs an Apple Development certificate and a Development provisioning profile that includes this phone’s UDID. See Certificates and signing.
Three ways to start
Pick one depending on what you’re doing.
| Mode | Where | When to use it |
|---|---|---|
| Build & Run | F5, ▶ in the KXBuild view title bar, inline button on a target | Everyday debugging after you change code. Builds, signs, installs, launches and attaches the debugger |
| Run | “KXBuild: Run”, inline button on a target | Code hasn’t changed and you just want to reinstall and launch the last build |
| Attach | “KXBuild: Attach to Running App” | The app is already running on the phone and the problem only shows up after using it for a while |
The build happens before the debug session starts, so the “Restart” button on the debug toolbar doesn’t recompile. After changing code, stop first, then press F5.
F5 works without a launch.json. Add one only when you want to pin a device, target or build configuration. For the fields, see Run and debug.
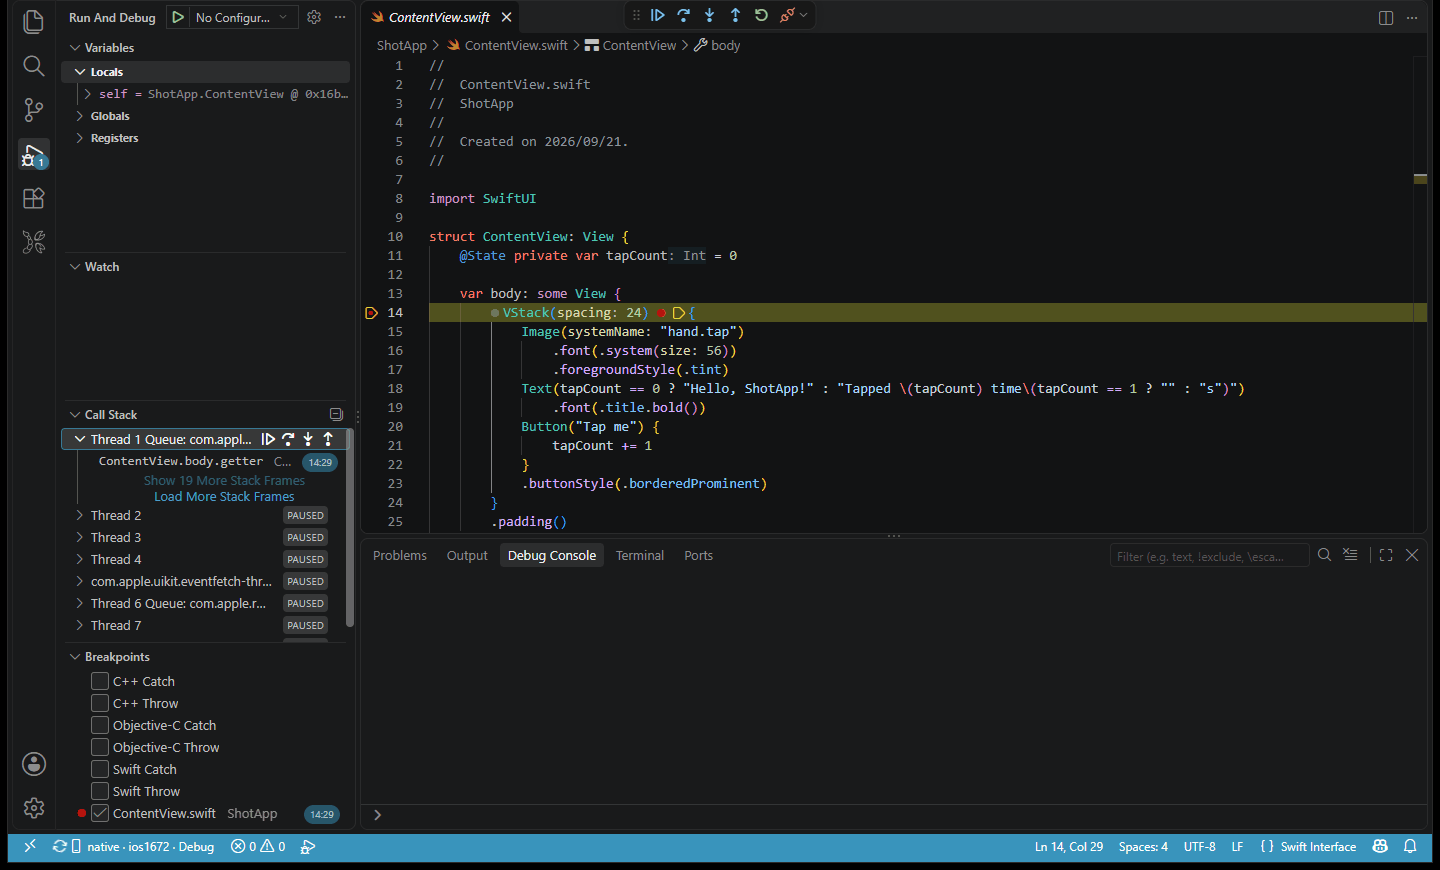
Set breakpoints
Click to the left of a line number to add a breakpoint. When it’s hit, you get the standard VS Code debug view, with the same shortcuts for step, continue and step out as in any other language. Add the breakpoint types below by right-clicking to the left of a line number, or change an existing one by right-clicking it and choosing “Edit Breakpoint…”.
Conditional breakpoints
In a loop or a frequently called function, a plain breakpoint stops too often. Right-click, choose “Add Conditional Breakpoint…”, select “Expression” and enter a condition in the source language. It only stops when the condition is true.
1index == 42 && item.name == "test"
In the same menu, choose “Hit Count” and enter 10 to stop only on the 10th pass. This helps with bugs that only show up on the Nth call.
Logpoints
Right-click, choose “Add Logpoint…” and enter a message. Each time execution passes that line, the message is printed to the Debug Console without stopping. Expressions in curly braces are replaced with their current values.
1Loading item {index}, count = {items.count}
Use it when you want to check a value without changing code and rebuilding. It’s faster than adding a print.
Exception breakpoints
While debugging, expand the Breakpoints section at the bottom of the Run and Debug view. It lists options such as Swift Throw, Objective-C Throw and C++ Throw. Check one to stop where the exception is thrown.
For Objective-C NSException crashes, such as an array index out of bounds or an unrecognized selector sent to an object, check Objective-C Throw. The debugger stops on the line that throws, which is much more direct than reading the crash report afterward.
Function breakpoints
Click “+” in the Breakpoints section title bar and enter a function name, such as viewDidLoad or -[MyViewController viewDidLoad]. It stops at the function’s entry without you having to find the source.
Inspect variables and the call stack
When a breakpoint is hit, each panel on the left answers a different question.
| Panel | What it’s for |
|---|---|
| Variables | Local variables and self in the current function. Objects expand level by level |
| Watch | Expressions you add, evaluated every time execution stops. Good for values you keep an eye on |
| Call Stack | The call chain for each thread. Click a frame to switch to it and see its variables |
You can also hover over a variable in the source to see its current value. When stopped somewhere without source, open the assembly view.
Run LLDB commands in the Debug Console
You can type LLDB commands straight into the Debug Console (Ctrl+Shift+Y). These are the most common.
| Command | What it does |
|---|---|
po self |
Prints the object’s description, the same as calling description |
p count * 2 |
Evaluates an expression and prints it with its type |
v |
Prints all local variables in the current frame without running code, so it’s fast |
bt |
Prints the current thread’s call stack |
bt all |
Prints the call stacks of all threads. Use it for hangs and deadlocks |
thread list |
Lists all threads and where each one stopped |
expr self.view.backgroundColor = .red |
Changes state at runtime. You see the effect after you continue |
If what you type is treated as an expression rather than a command, prefix it with a backtick, for example `bt.
View app output and device logs
Output from print, NSLog and os_log in your app appears in Output > KXBuild Console, and build logs are in the KXBuild channel. Open the Output panel with Ctrl+Shift+U and switch channels with the drop-down in its top-right corner.
When the app isn’t being debugged, or you need system-level logs, read the phone’s logs directly with kxdevice. ostrace outputs only os_log, which NSLog and Logger both go through. It’s cleaner than syslog and can filter by subsystem and level.
1kxdevice ostrace --subsystem com.example.myapp --levels error,fault
syslog outputs the whole device’s system log. It’s very noisy, so filter it with findstr.
1kxdevice syslog | findstr MyApp
Get crash reports and find the cause
When your app crashes on the phone, iOS writes a crash report. If F5 says didn’t start in time, the app usually crashed right at launch. List the reports on the phone first, then download them.
1kxdevice crash list MyApp*
2kxdevice crash pull .\crashes MyApp*
Open the downloaded .ips file in a text editor and read it in this order.
- Exception type.
EXC_BAD_ACCESSusually means accessing freed memory or a null pointer.EXC_CRASH (SIGABRT)usually means an uncaught exception or a failed assertion.EXC_BREAKPOINTin Swift is often a force-unwrapped nil or an array index out of range. - Last Exception Backtrace. If this section exists, it’s an Objective-C exception, and this call stack is more useful than the crashed thread’s.
- The crashed thread’s call stack. Find the first frame that belongs to your app. That’s usually where the problem is.
If your app’s frames show only addresses without function names, the most direct fix is to reproduce the crash with the Debug configuration and F5. The debugger stops on the crashing line, where you can see the call stack and variables. For Objective-C exceptions, add the exception breakpoint described above.
If you’d rather not remember commands, run kxdevice web and open http://localhost:8780 in your browser to view crash reports, the system log and the process list.
Attach to an app that’s already running
Some problems only show up after using the app for a while and are hard to reproduce after a restart. In that case, leave the app running and attach the debugger to it.
Run “KXBuild: Attach to Running App” from the Command Palette. It lists the apps running on the phone. Pick one. Once attached, breakpoints, variables and the Debug Console work as described above. The app must be signed with a development certificate. Apps downloaded from the App Store can’t be attached to.
Common errors
| Message | Fix |
|---|---|
| No iOS device selected | Select a device in the KXBuild view |
| Developer Mode is off | Turn on Developer Mode on the phone and restart it |
| Developer Disk Image is not mounted | Unplug and replug the phone, or run doctor |
| The device is not paired/trusted | Unlock the phone and tap Trust |
| did not report the app as launched in time | Unlock the phone and check the cable |
| didn’t start in time | The app may be crashing at launch. Get the crash report as described in the previous section |
| Breakpoints don’t stop, or only stop in assembly | Switch to the Debug configuration and wait for the device symbols download to finish |
For signing and install errors, see 16 common iOS code signing and .ipa install errors. For other errors, see Troubleshooting.